Pattern Gallery
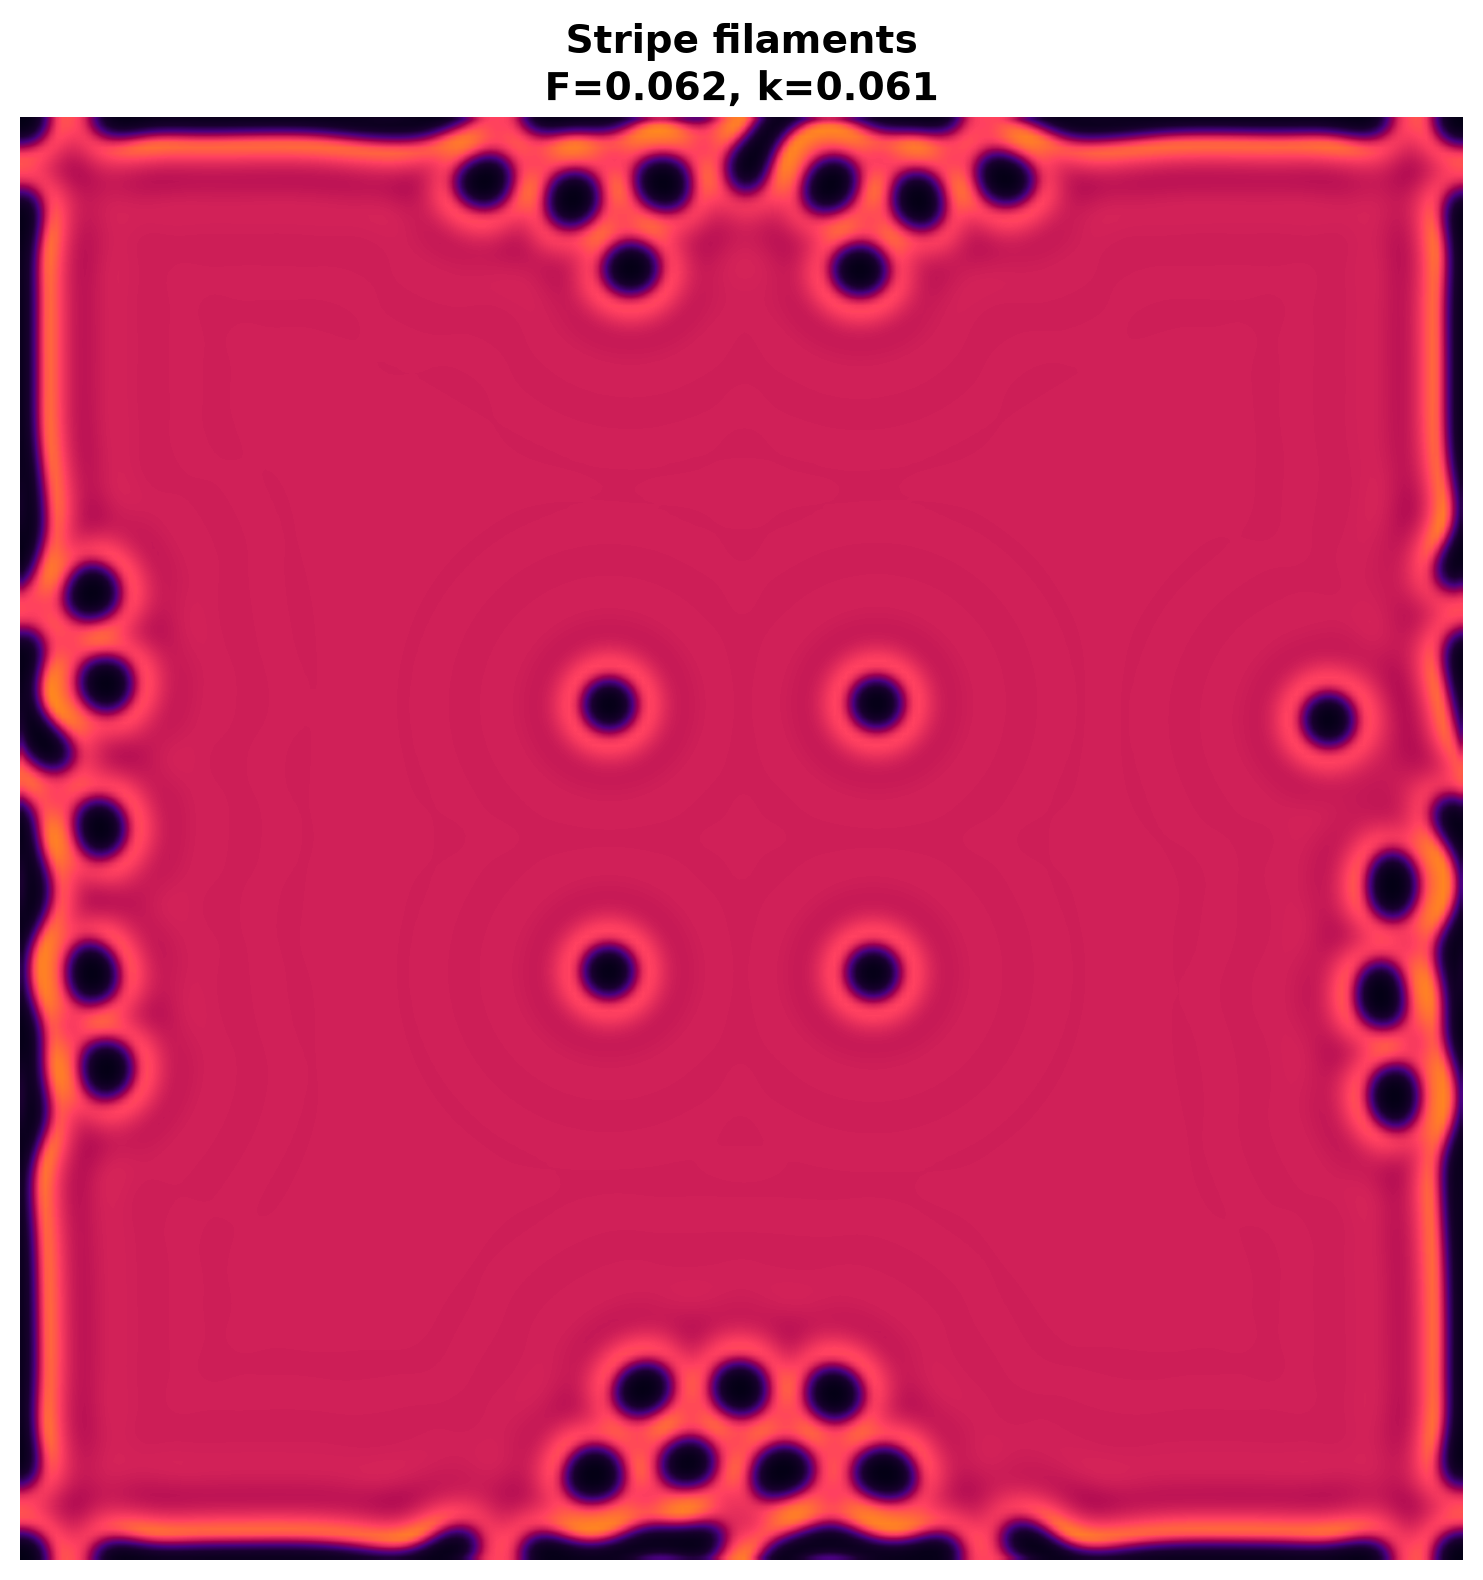
Nine showcase patterns from the Gray-Scott parameter space, each rendered at 256×256 resolution after 15,000 time-steps. These are not generated images or ML outputs — they are deterministic solutions to coupled partial differential equations, rendered directly from the simulation data.
Each pattern is labeled with its (F, k) parameters and a descriptive name based on the visual morphology. The patterns span the full diversity of the Gray-Scott “zoo” discovered by Pearson (1993).
The Atlas
How to Read These
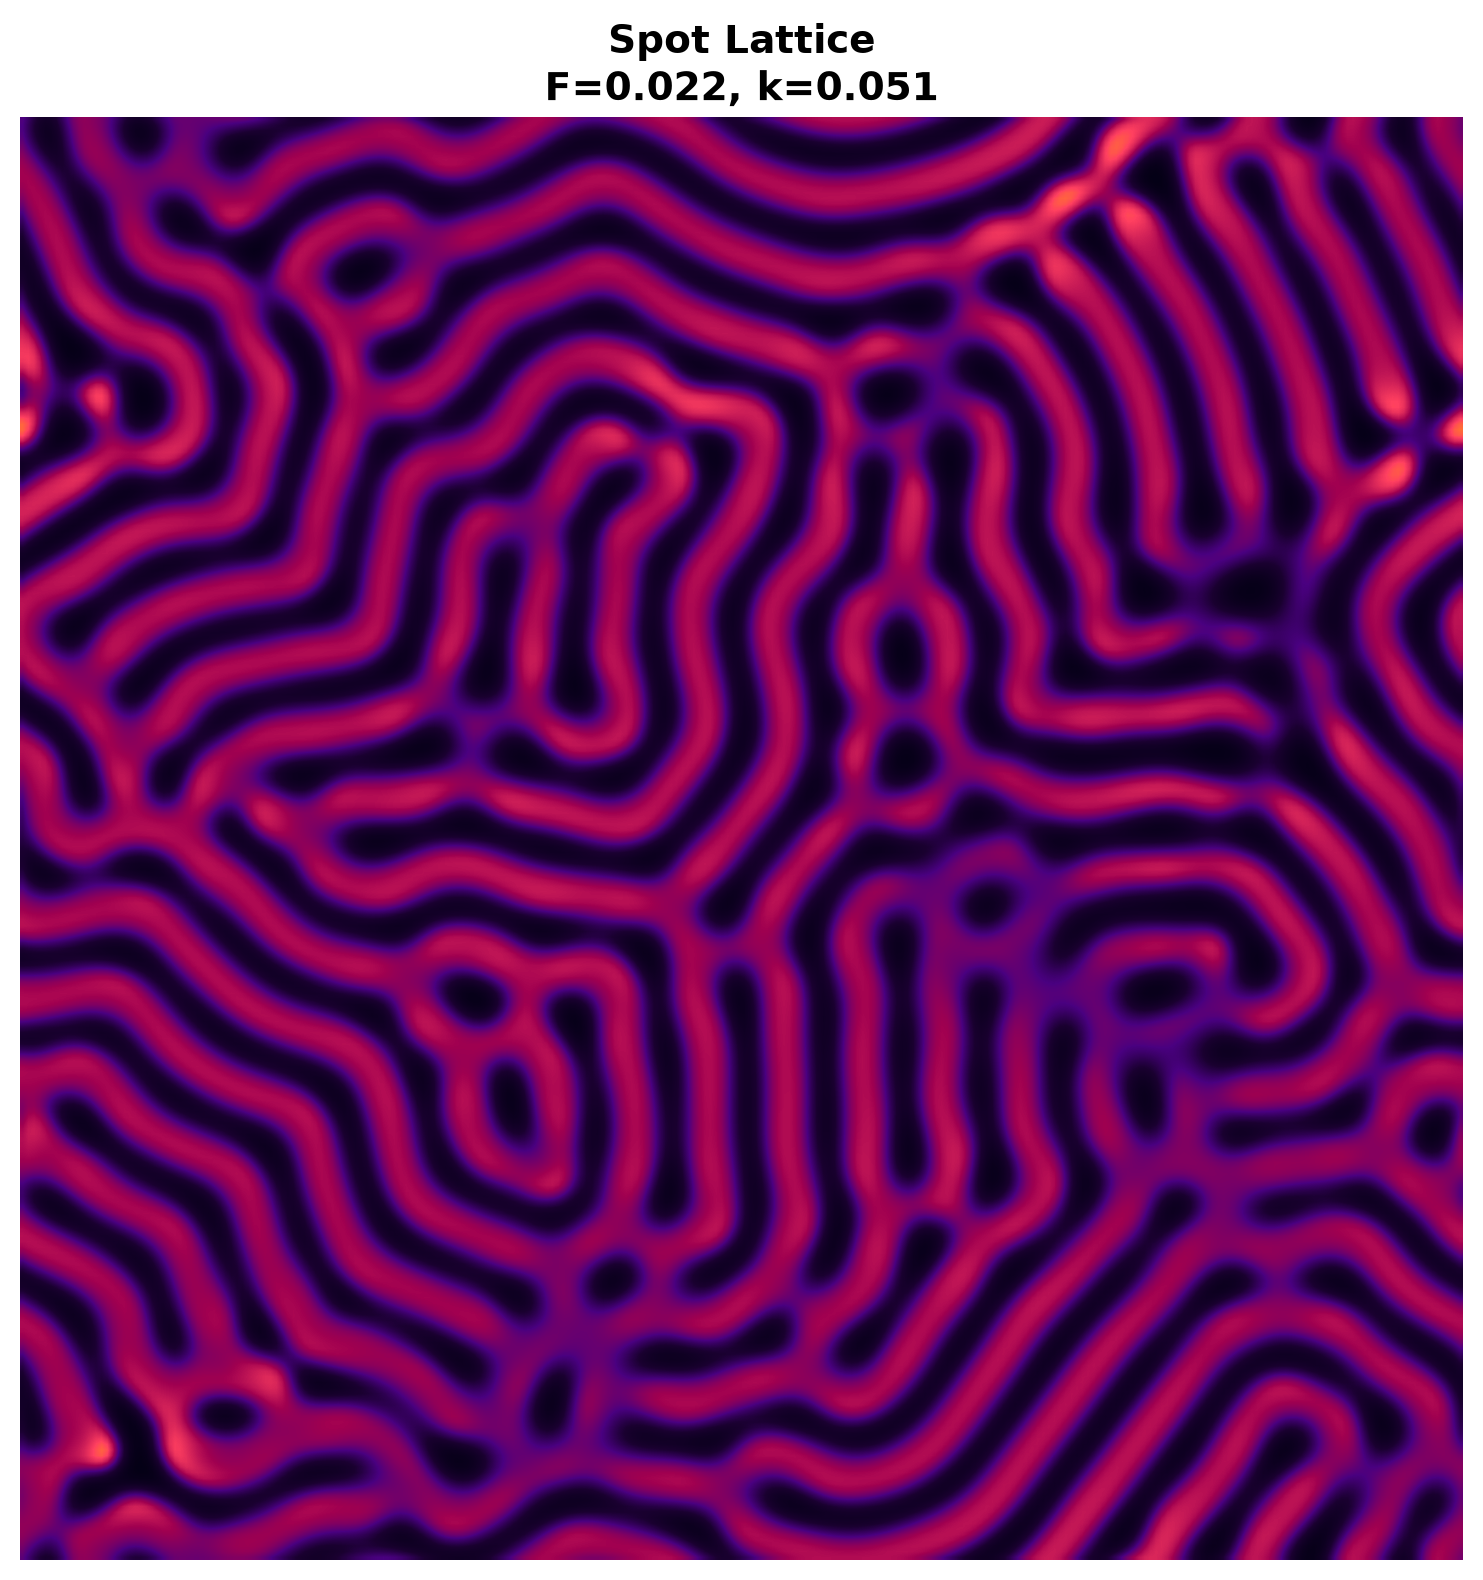
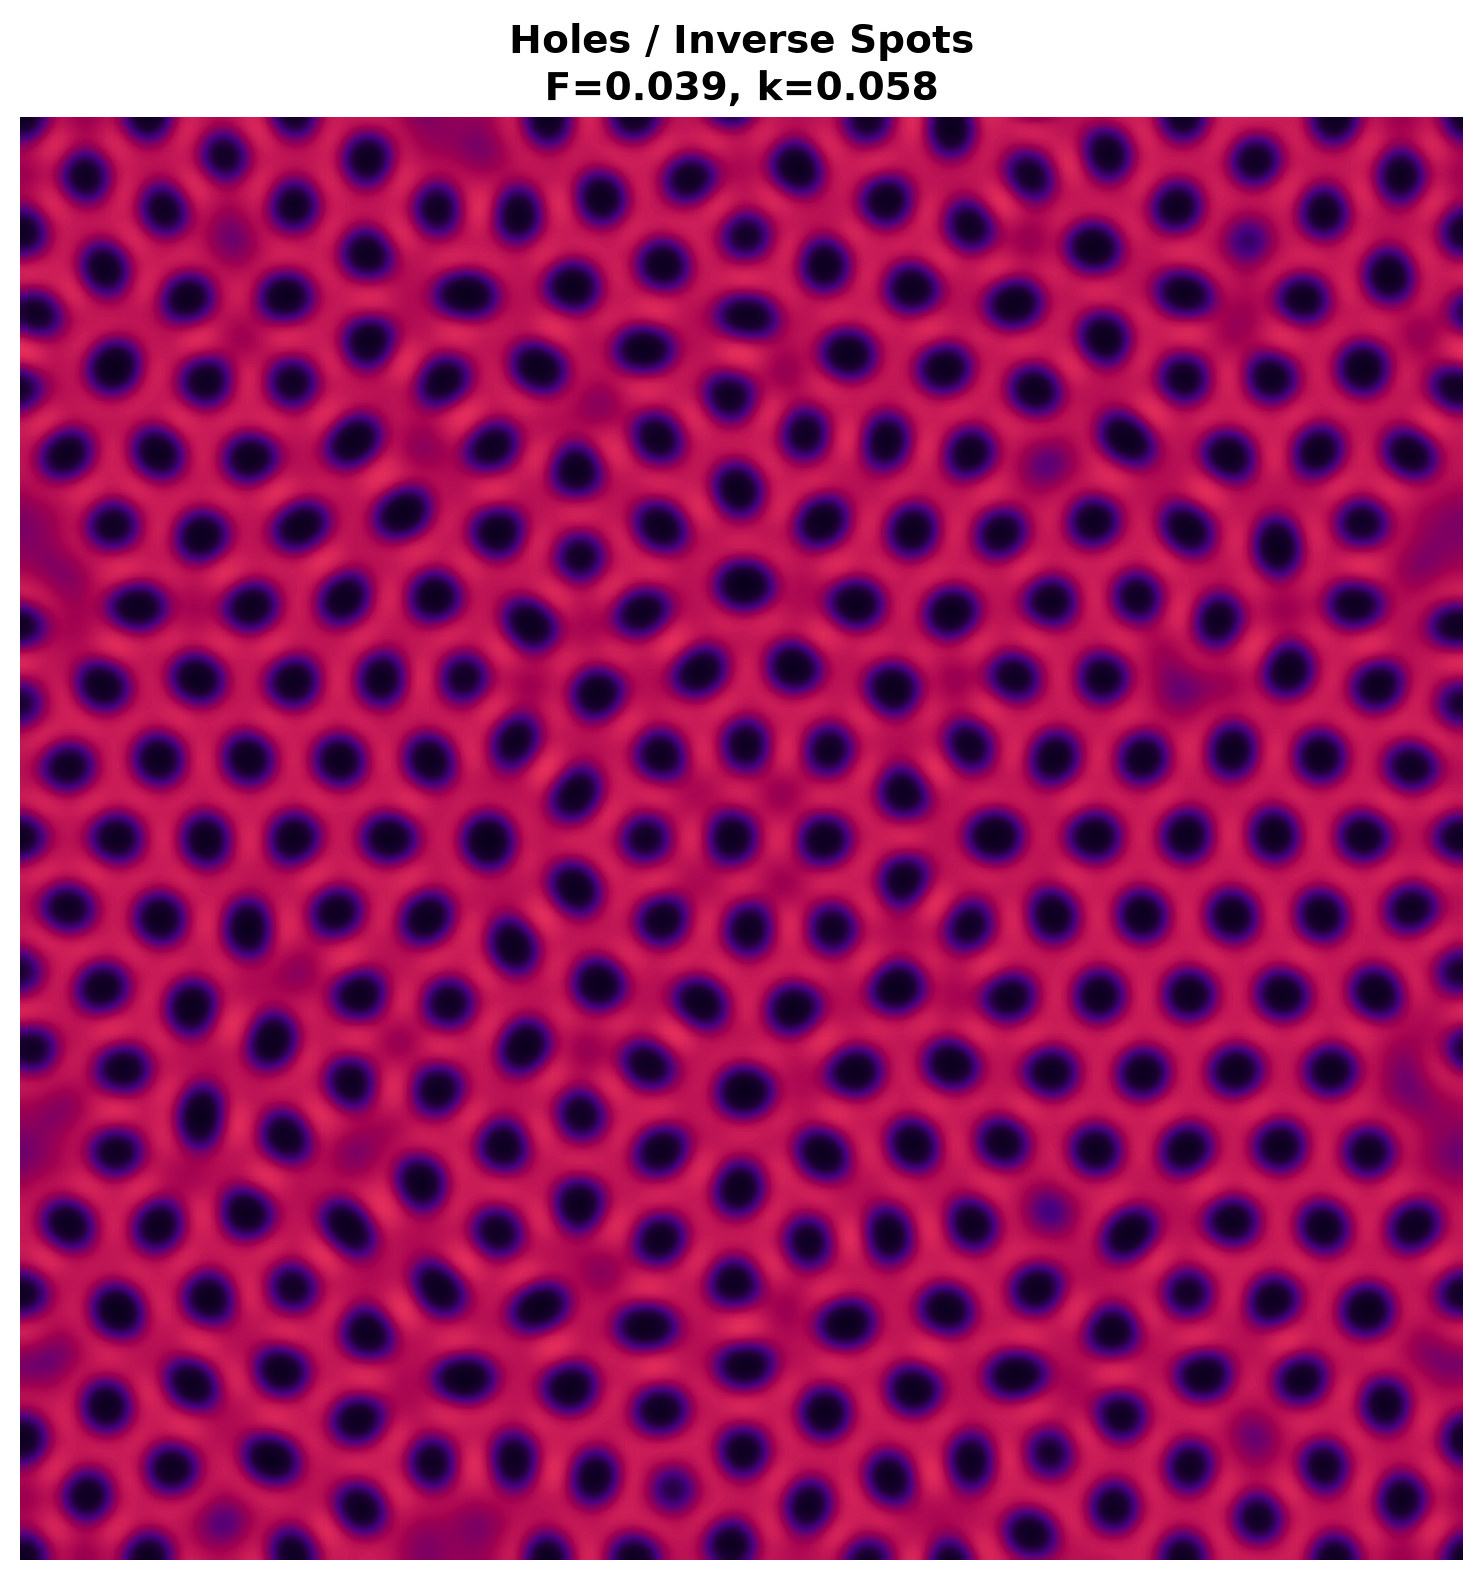
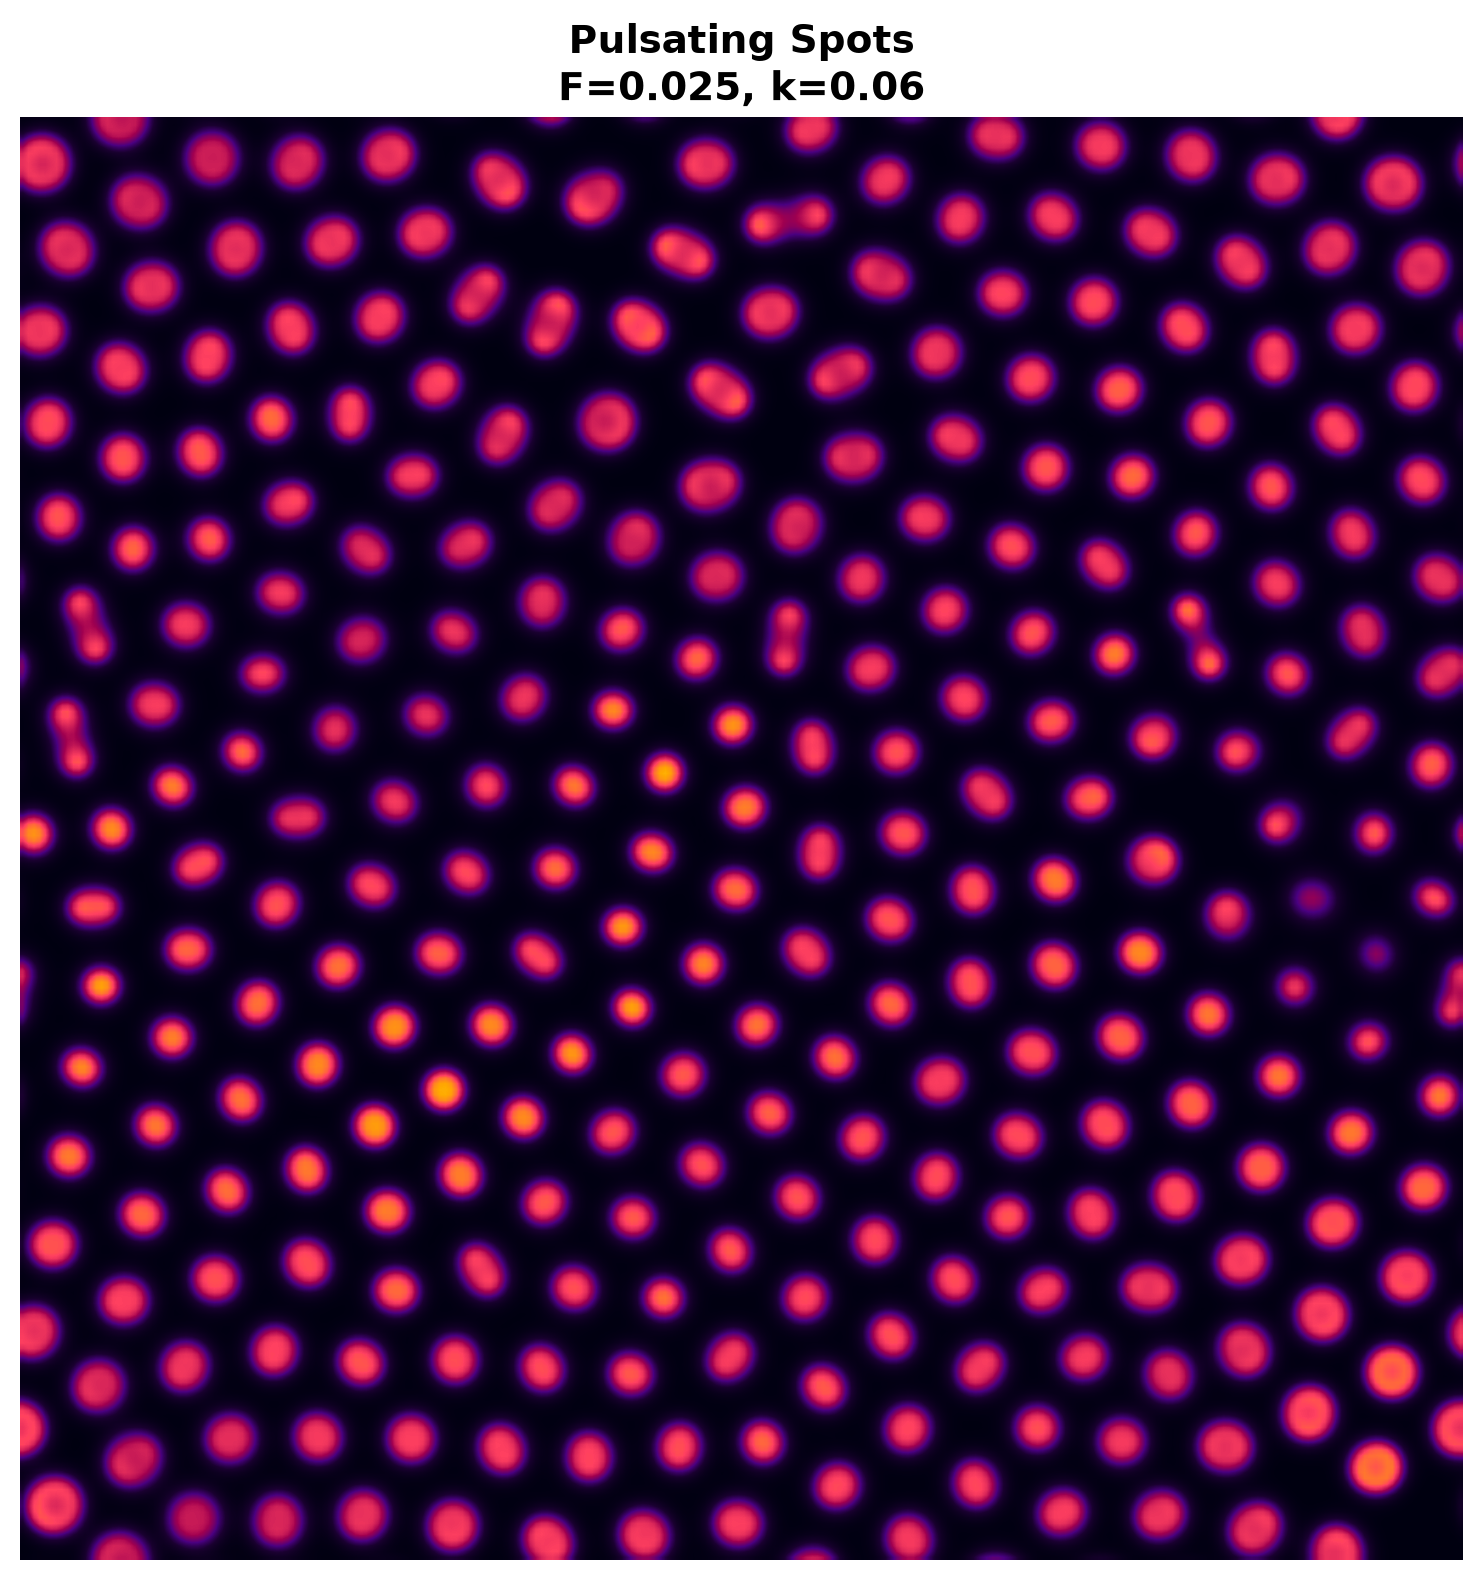
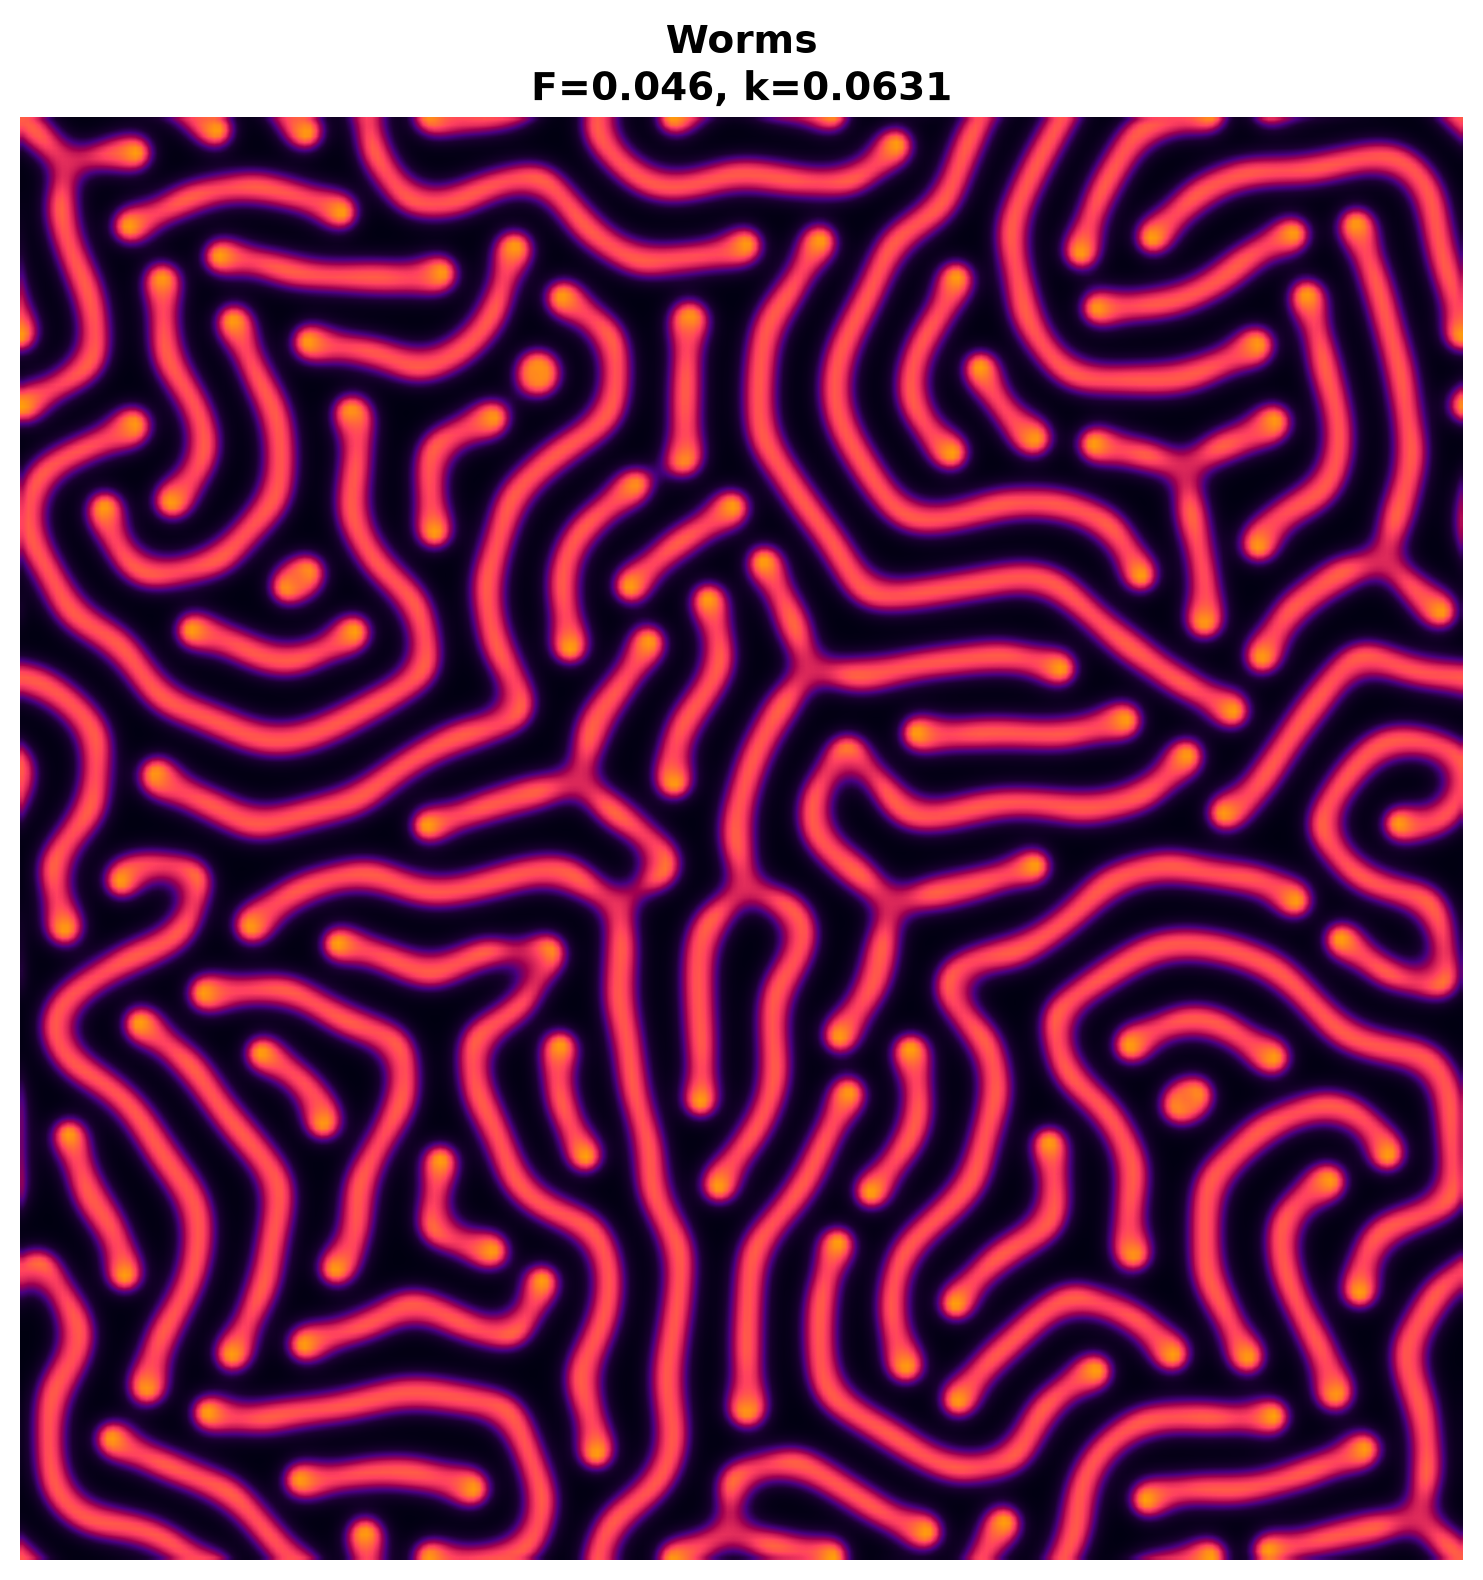
Each image shows the concentration field of chemical species V (the autocatalyst). Bright colors indicate high V concentration; dark areas are dominated by species U. The colormap runs from deep purple (v≈0) through orange to bright yellow (v≈0.5).
The same initial conditions are used for every simulation: a uniform field with a single square perturbation at the center. The spectacular diversity you see comes entirely from changing two numbers — F and k.
Pattern Taxonomy
| Pattern | F | k | Mechanism |
|---|---|---|---|
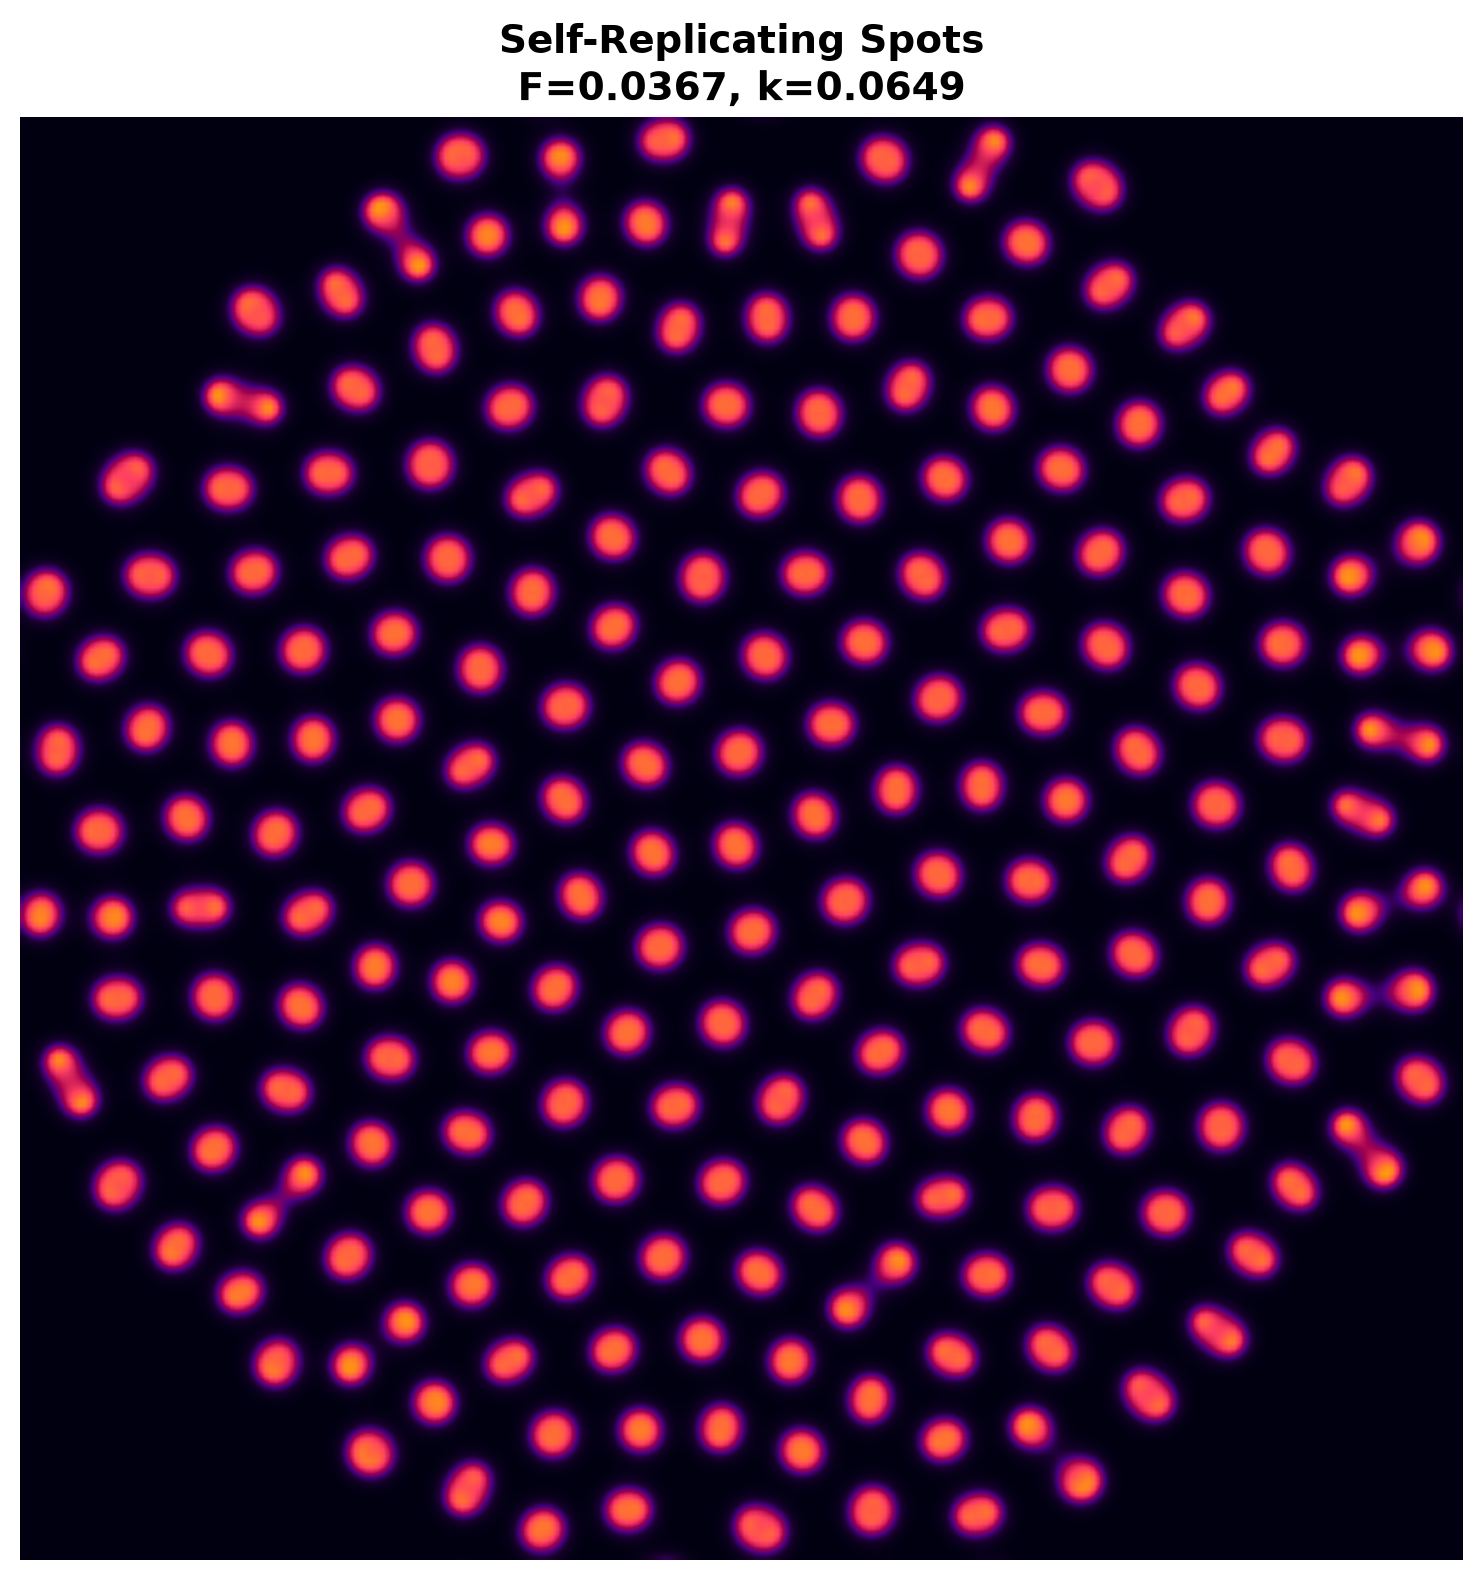
| Self-Replicating Spots | 0.0367 | 0.0649 | Spots grow, elongate, pinch, and split — like cell division |
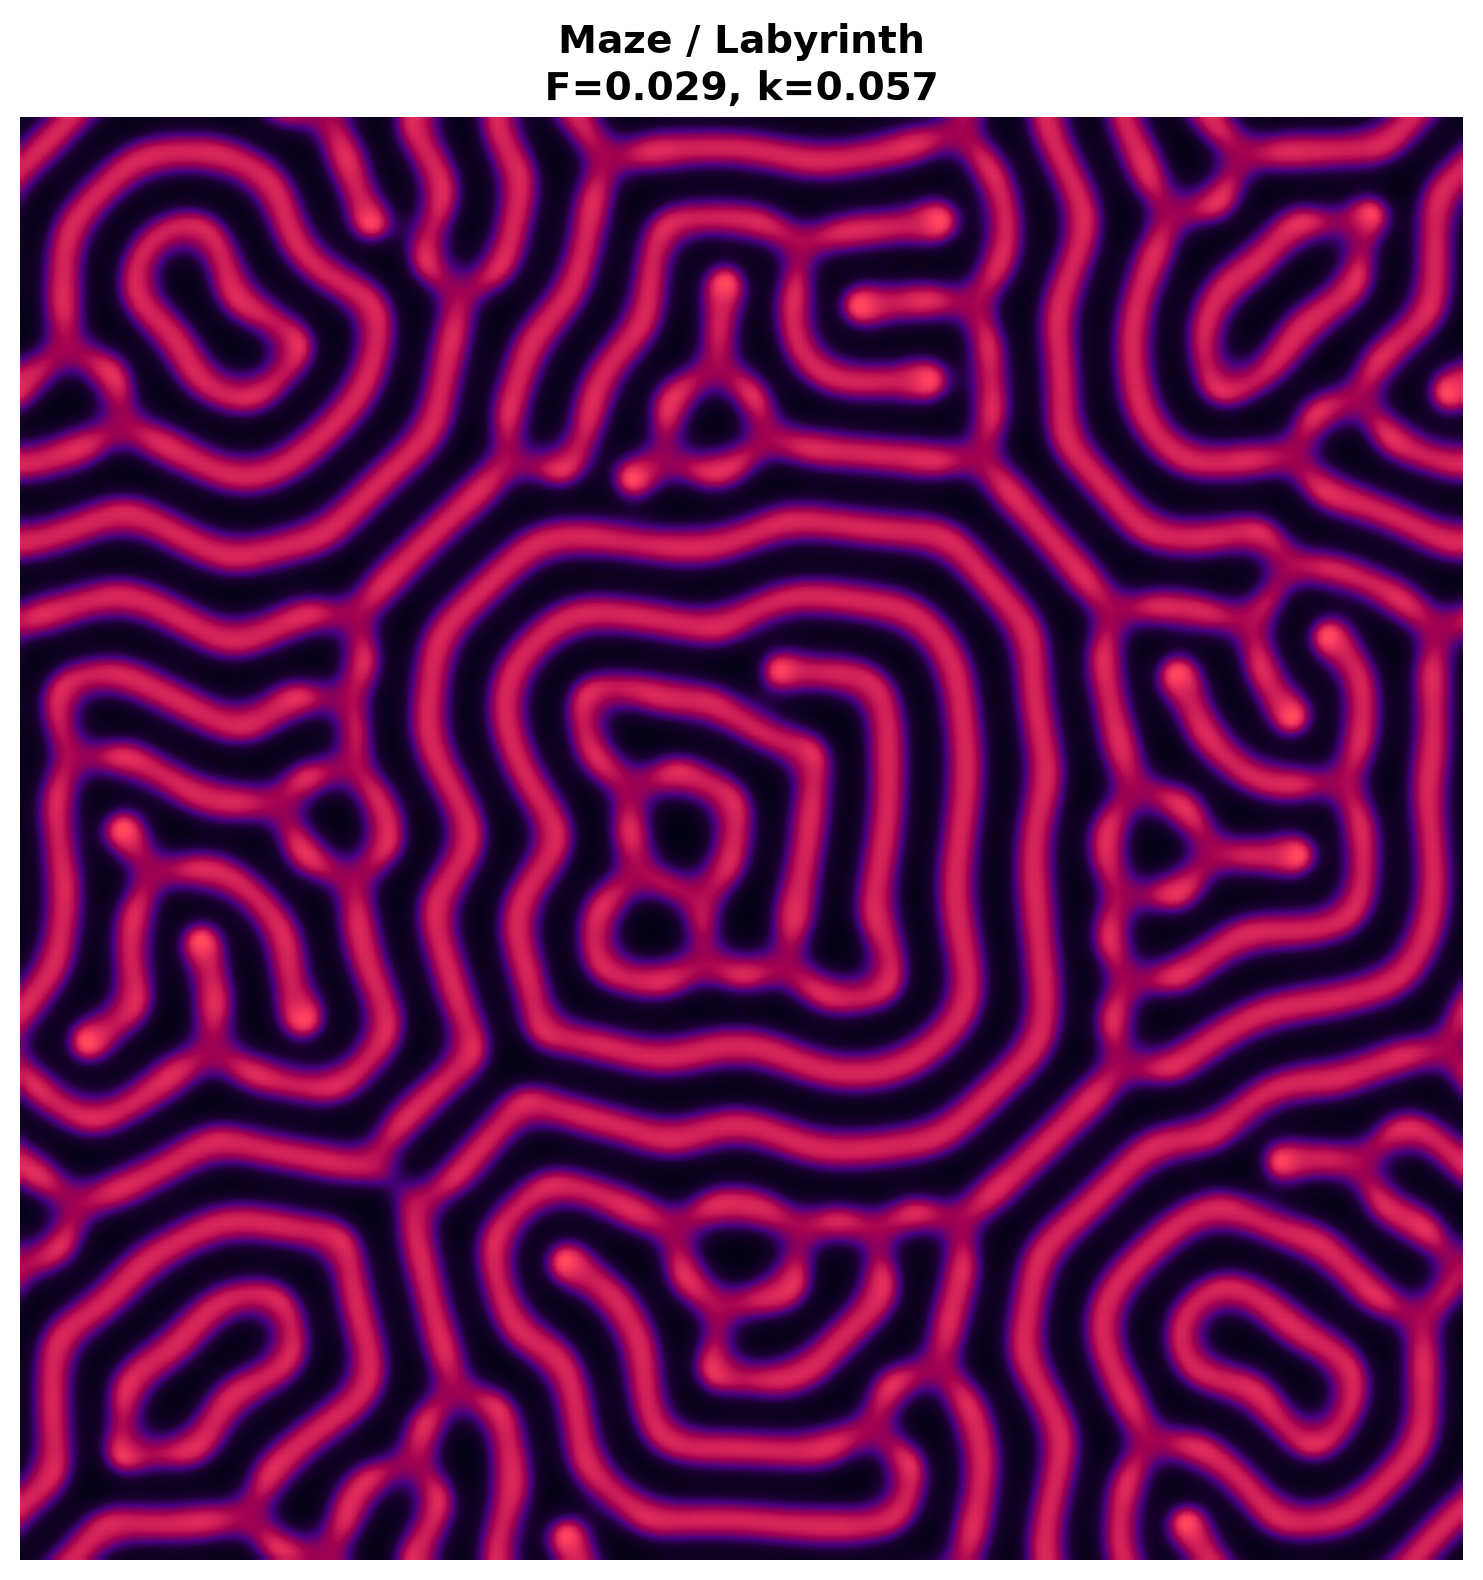
| Maze / Labyrinth | 0.029 | 0.057 | Stripes interconnect into branching networks |
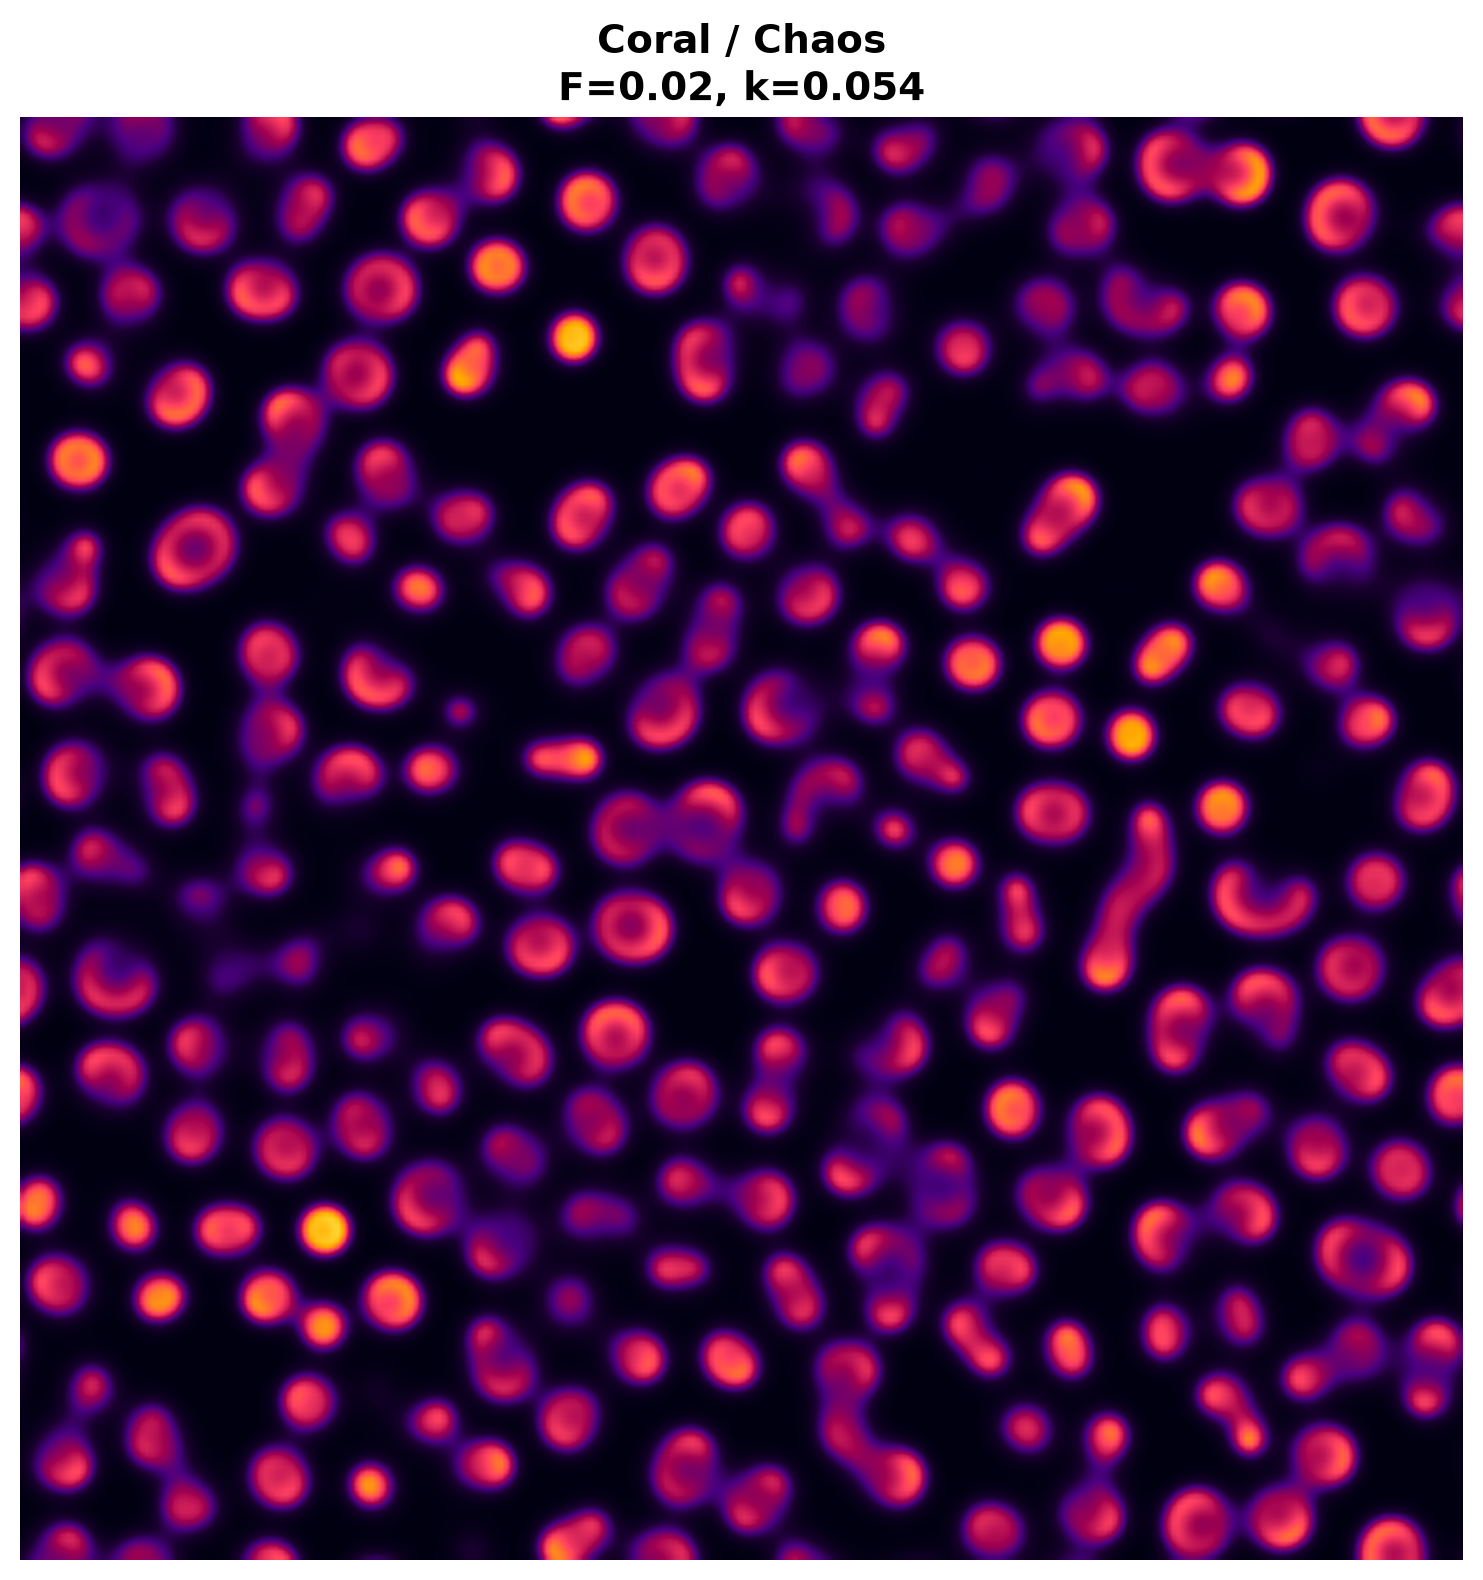
| Coral / Chaos | 0.020 | 0.054 | Filamentous branching growth — never stabilizes |
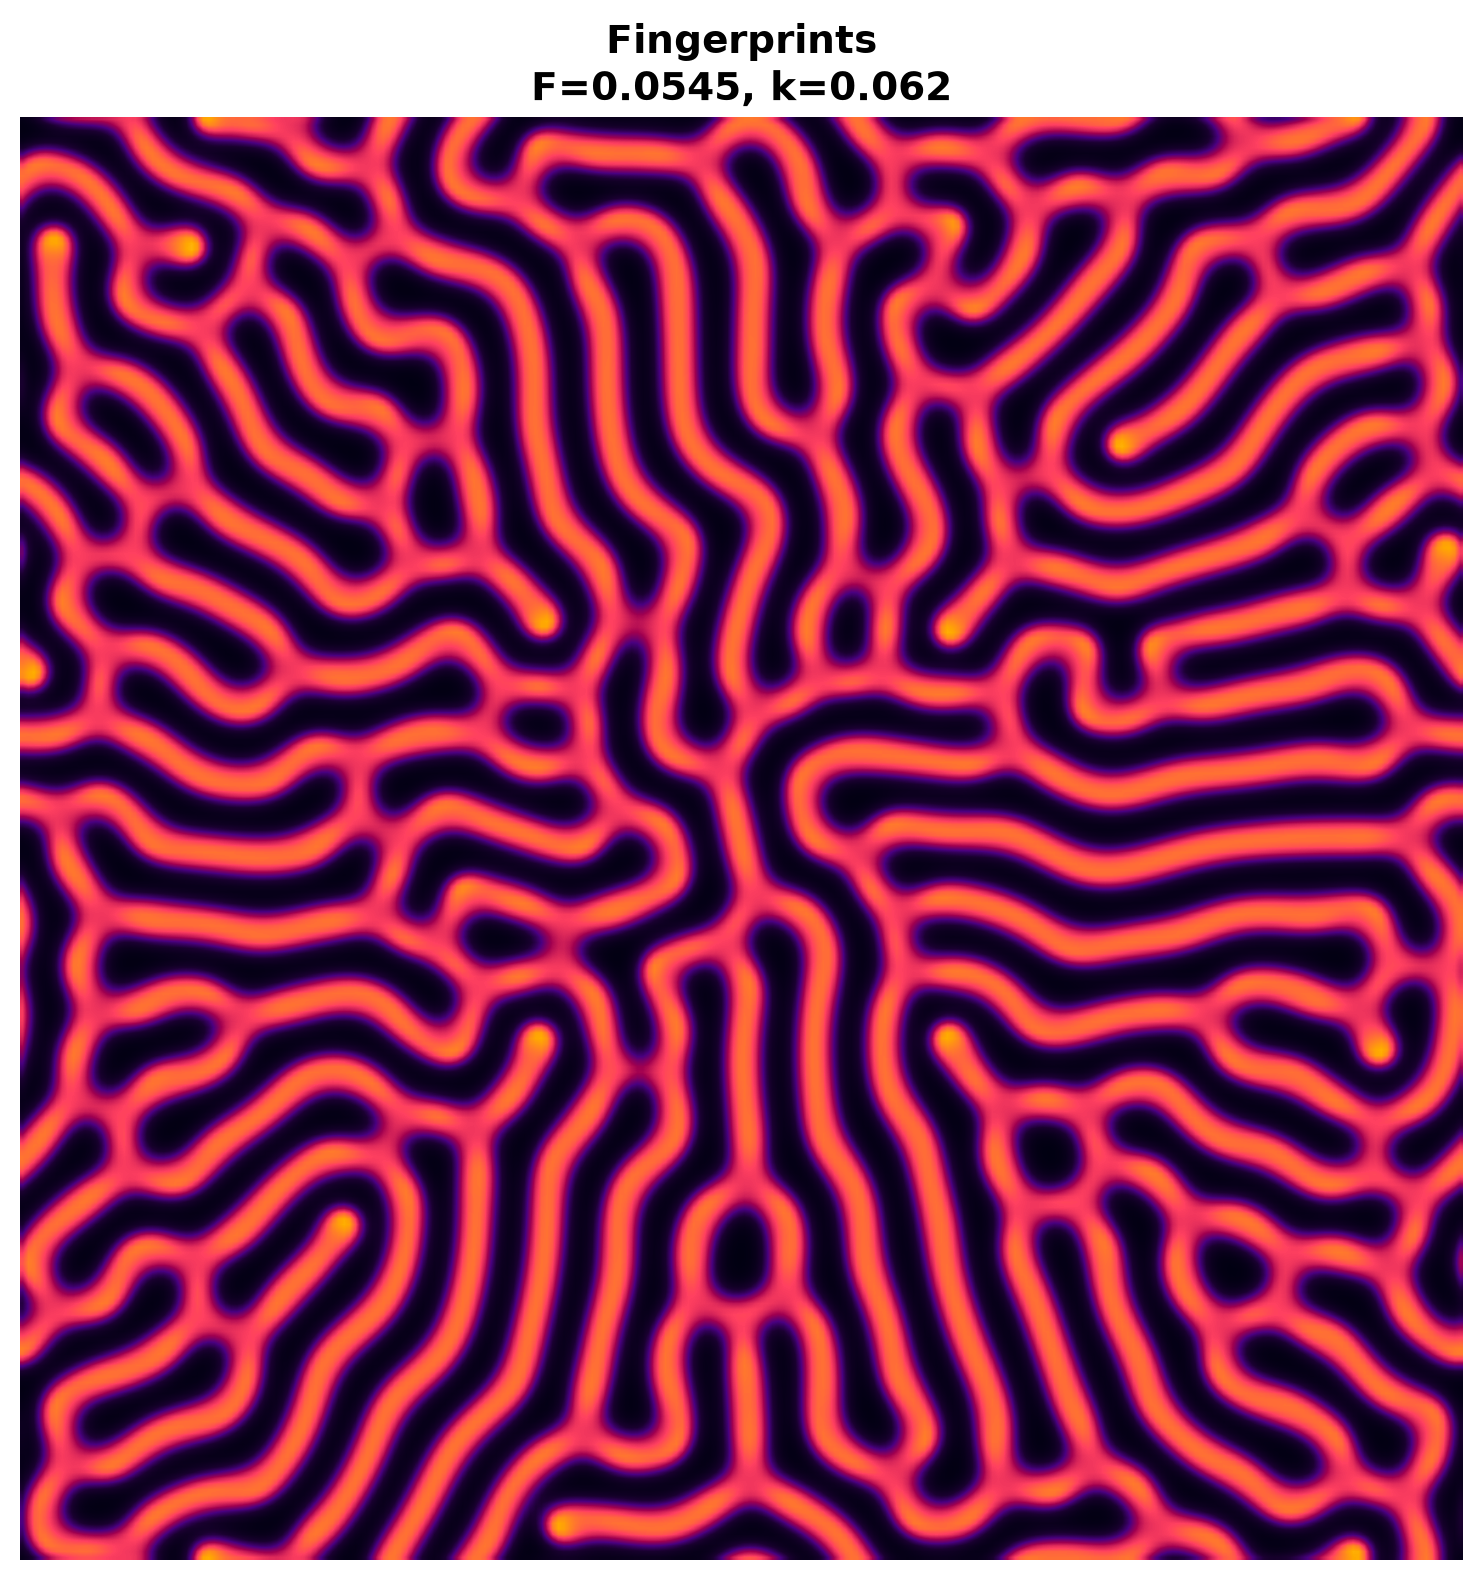
| Fingerprints | 0.0545 | 0.062 | Parallel stripe arrays that self-organize |
| Spot Lattice | 0.022 | 0.051 | Quasi-hexagonal packing of stable spots |
| Holes / Inverse Spots | 0.039 | 0.058 | Negaton-dominated: V everywhere except circular holes |
| Pulsating Spots | 0.025 | 0.060 | Spots that breathe — oscillating in amplitude |
| Worms | 0.046 | 0.0631 | Elongated stripes that grow from each end |
| Stripe Filaments | 0.062 | 0.061 | Thin branching lines — the edge of pattern existence |
More from Herman — see this project on the main site, alongside other work like Pokemon Emerald: Cathode, the Bobiverse novel, and the dashboard platform.